What is Grafana?
Grafana is an open source tool to visualize data interactively. Users can visualize data using charts and graphs.
Users can create multiple dashboards, each with multiple charts and graphs (panels).
Data sources are used by Grafana to fetch data. The user can choose which data source to use since Grafana supports many types of data sources.
How to export a Grafana dashboard?
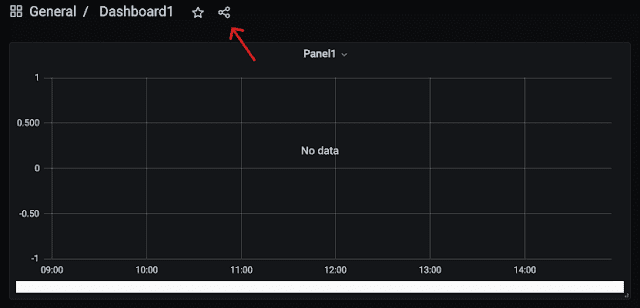
You can export a dashboard from Grafana using the share option in the top left corner, as shown in the below image.
By creating a link, you can share your dashboard with anyone.
If you want to download the dashboard locally as a JSON file, go to -> export tab -> click save to file. Now the dashboard will be downloaded as a JSON file.
JSON file contains dashboard details such as panels, variables, annotations etc.
You can export only one dashboard at a time, which means you cannot export all the dashboards at once. Grafana does not have that feature.
If you have a lot of dashboards, exporting them one by one becomes a really difficult and time-consuming task.
Grafana exports all dashboards at once
Grafana does not have an export feature that lets you export all dashboards at once. We are planning to write a Python script that will export all dashboards at once.
The exported dashboards will be stored in the same Grafana folder order and name.
The Python script needs two inputs to export all dashboards. First is the Grafana URL and second is the API_key.
How to generate API keys in Grafana
The API key is used to authorize our API call with Grafana.
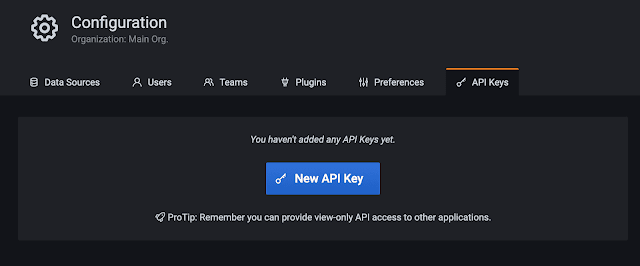
To generate an API_key, navigate to configuration -> API Keys -> click on New API key.
You will see a pop-up asking for the following information. Once you have given all the information, click Add.
Key name – any name you want
Role - select admin if you are making API calls to Grafana. Since we are planning to export all at once we will choose admin here.
The time to live specifies how long this key needs to be valid after which it gets expired. According to this definition, it is 1h (one hour).
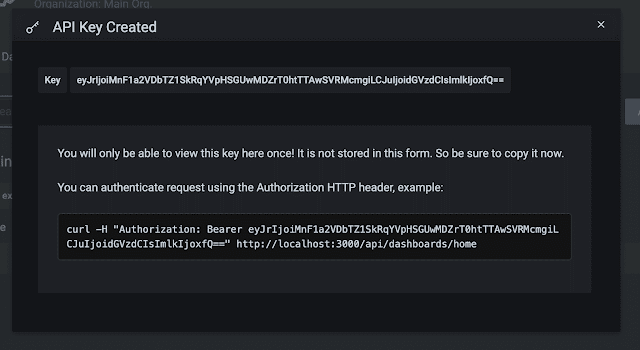
Now you can see we have our API key created as shown in the below image. Please save the key somewhere because once you close the popup you cannot review the key again.
Python script
My machine has Python 3.10.8 installed, so I run the script below using python3 import-dash.py. Based on the Python installed on your machine the command to run the script may change a little bit.
Before running the script, open the script and update the HOST and API_KEY variables.
#!/usr/bin/env python
import json
import requests
import os

# curl -H
# "Authorization: Bearer eyJrIjoiWnFzYTlITTB0ZkdYZkp1VzJZajBqZWlVMGZLVVcwSGEiLCJuIjoiYmhhcmF0aCIsImlkIjoxfQ=="
# http://localhost:3005/api/dashboards/home

# grafana host without /
HOST = "http://localhost:3000"

# API key generted from grafana
API_KEY = (
    "eyJrIjoiSDJYQkt3bzBMMVN1cHdwYnUyWXl2STc3ZDdlSEtTbVgiLCJuIjoidGVzdDIiLCJpZCI6MX0="
)

# path where the folders and dashboards must be saved
DIR = "dashboards/"

updateDashboardToGrafana9 = False

# counters
FOLDERCOUNTER = 0
DASHBOARDCOUNTER = 0


def main():
    global DASHBOARDCOUNTER
    headers = {"Authorization": "Bearer %s" % (API_KEY,)}
    r = requests.get("%s/api/search?query=&" % (HOST,), headers=headers)
    dashboards = r.json()
    if r.status_code == 200:

        # curl --location --request GET 'http://localhost:3005/api/dashboards/uid/mOYp0tL7k' \
        # --header 'Accept: application/json' \
        # --header 'Content-Type: application/json' \
        # --header 'Authorization: Bearer eyJrIjoiWnFzYTlITTB0ZkdYZkp1VzJZajBqZWlVMGZLVVcwSGEiLCJuIjoiYmhhcmF0aCIsImlkIjoxfQ=='

        for d in dashboards:
            if d["type"] == "dash-db":
                r = requests.get(
                    "%s/api/dashboards/uid/%s" % (HOST, d["uid"]), headers=headers
                )
                if r.status_code == 200:
                    metadata = r.json()["meta"]
                    data = r.json()["dashboard"]

                    dash = dash_cleanup(data)

                    name = (
                        data["title"]
                        .replace(" ", "_")
                        .replace("/", "_")
                        .replace(":", "")
                        .replace("[", "")
                        .replace("]", "")
                    )
                    createFolder(metadata["folderTitle"])
                    documentpath = os.path.join(
                        DIR + metadata["folderTitle"], name + ".json"
                    )
                    tmp = open(documentpath, "w")
                    tmp.write(dash)
                    tmp.write("\n")
                    tmp.close()
                    DASHBOARDCOUNTER += 1
                    print(
                        "Fected dashboard %s.json and stored in -- %s"
                        % (name, DIR + metadata["folderTitle"])
                    )
                else:
                    print("Error code %s and message %s" % (r.status_code, r.content))

    else:
        print("Error while exporting %s" % (r.content))

    print(
        "Created %s folder and downloaded %s dashboard"
        % (FOLDERCOUNTER, DASHBOARDCOUNTER)
    )


def createFolder(foldername):
    global FOLDERCOUNTER
    # Create folder for dashboard
    if not os.path.exists(DIR + foldername):
        os.makedirs(DIR + foldername)
        print("Dashboard folder created -- %s" % (foldername))
        FOLDERCOUNTER += 1


def dash_cleanup(dashboardjson):
    return json.dumps(dashboardjson, sort_keys=True, indent=4, separators=(",", ": "))


if __name__ == "__main__":
    main()


